Learning ACI - Part 3: Getting Familiar with the APIC
03 Dec 2014Hello again! Hopefully you’re back after reading parts one and two of this series - in the first post, I covered a basic introduction to ACI and then in the last post, we looked at how the fabric initialisation and discovery process works. After the incredible excitement of building an ACI fabric, what do we do with it? Well, if you’ve never seen what an APIC looks like before, in this post we’ll have a look around the APIC and start to find our way around the GUI.
The Dashboard
After initialising your APICs, you can browse to any one of the APIC out-of-band IP addresses (there is no ‘cluster’ IP address with the APIC) and log on. The first thing you will see is the main ‘dashboard’ screen, which looks something like this:
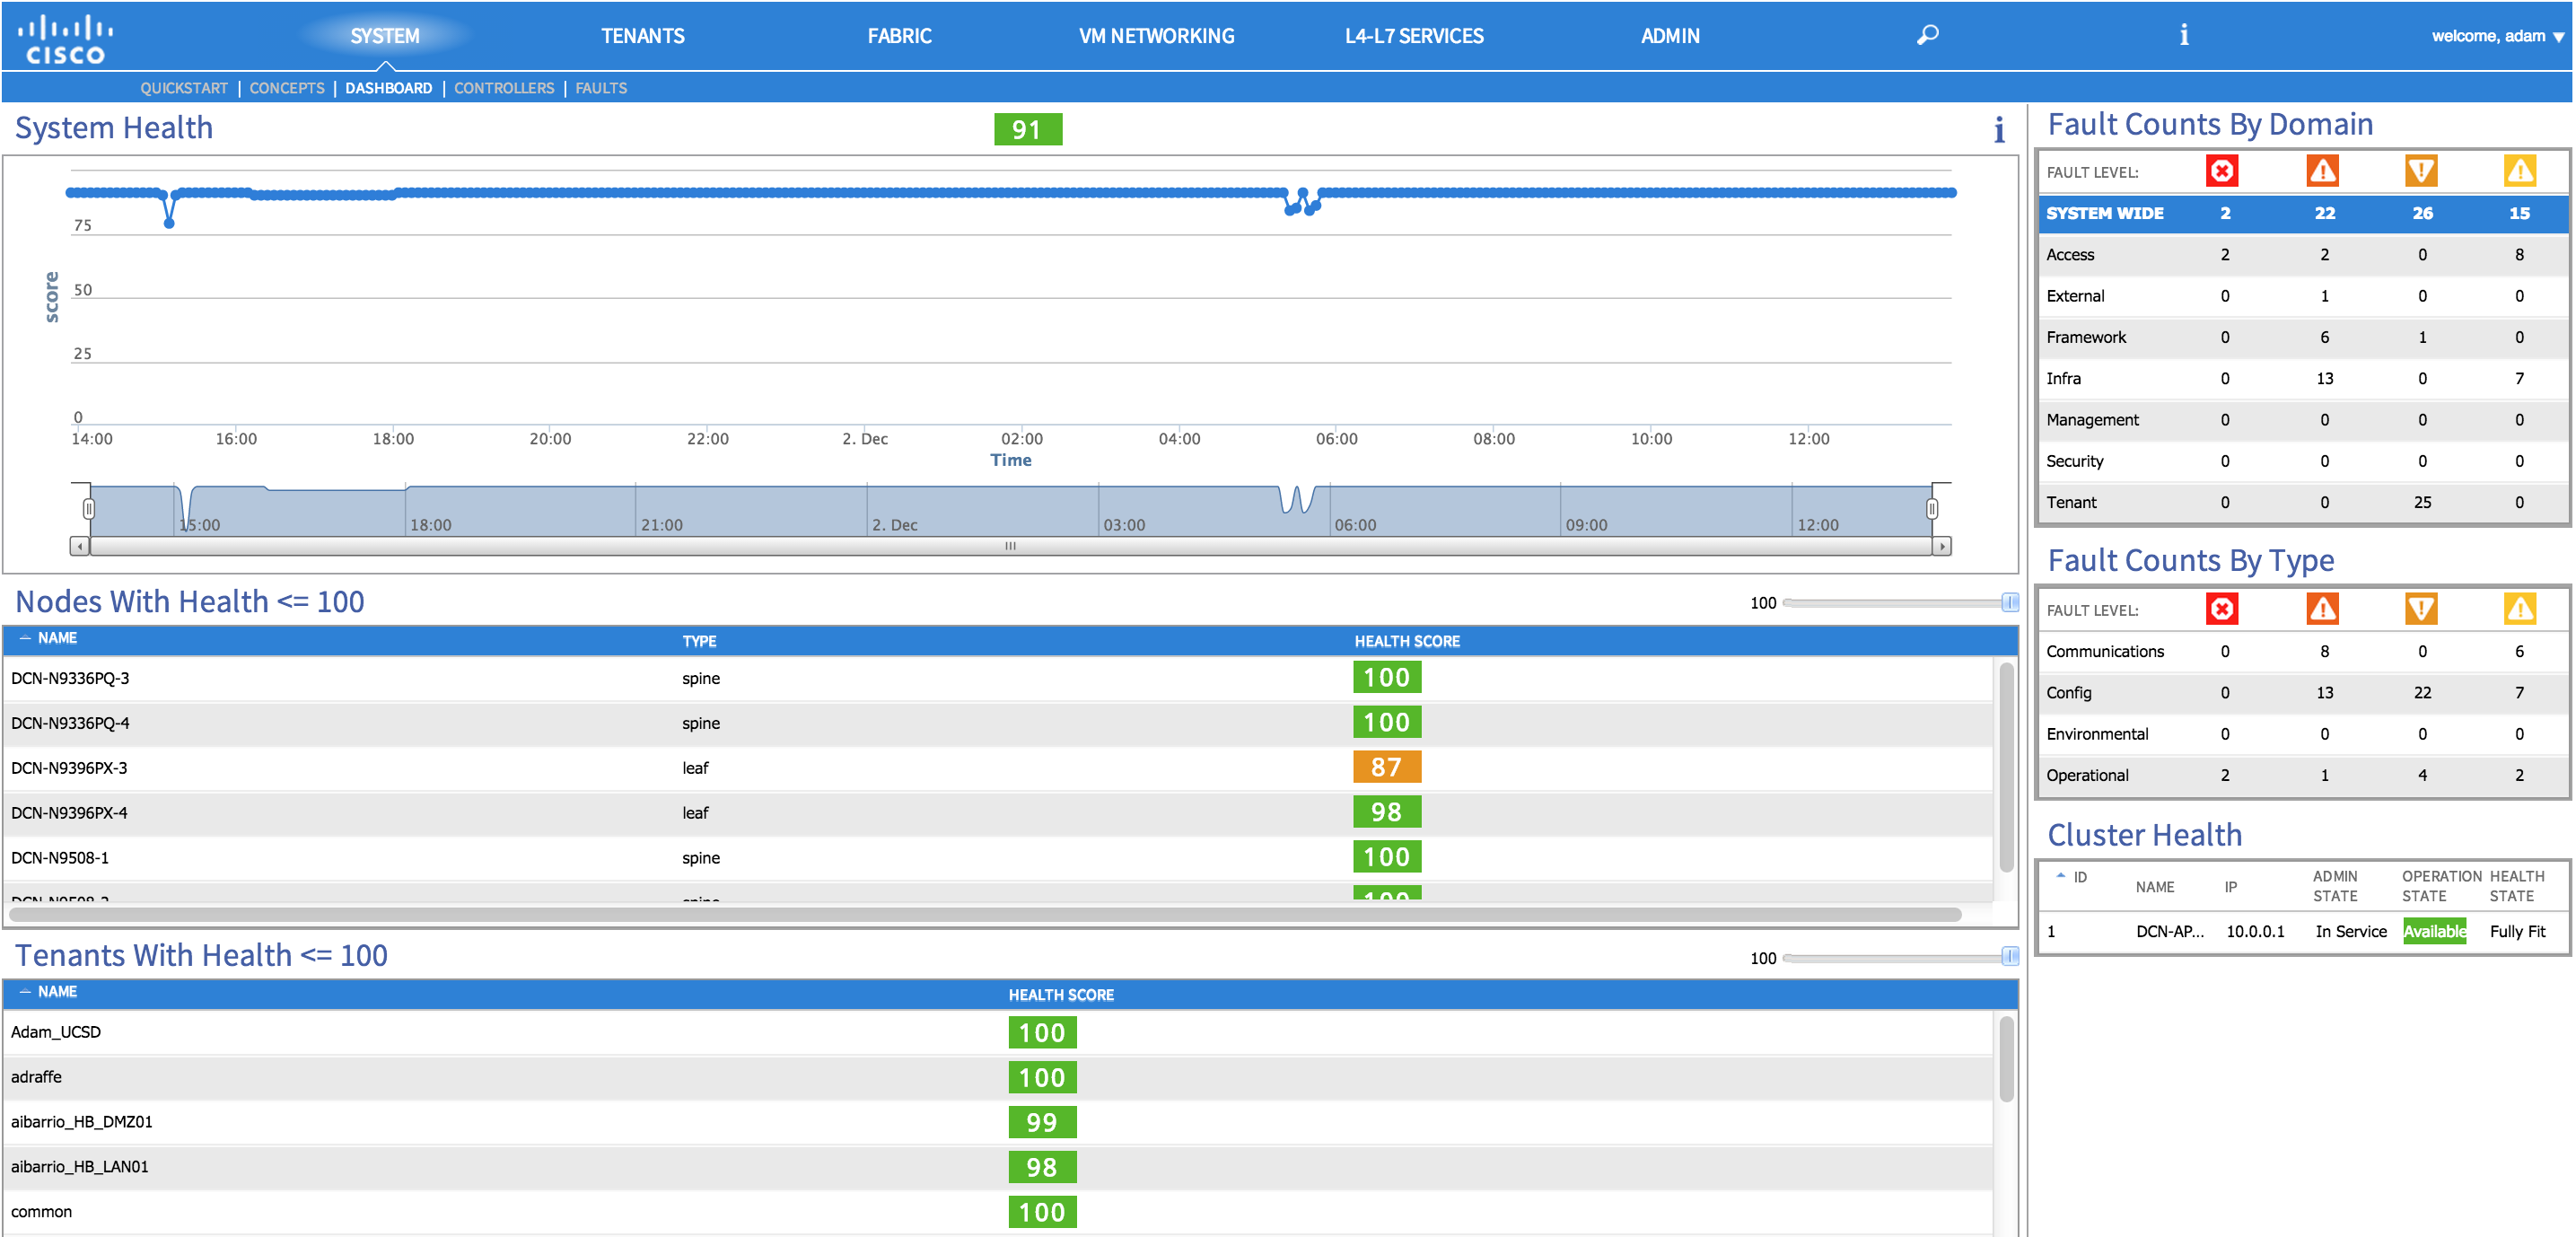
At the top, we get an overall view of the system health - on my fabric, I have an overall health score of 91, so that tells me that there is something needing attention. Further down, we can see a ‘node’ view which shows the individual switching nodes in the fabric and their corresponding health scores. From here, I can see that one of my nodes has a health score of 87, so that is a good place to start in investigating my issue. Clicking on the health score in this section takes you directly to a more detailed view of the node in question, where you can investigate faults and other relevant information.
At the bottom of the screen we have the tenant health view, indicating where there may be issues with any particular tenant (for example, a problem with an application profile). Once again, clicking on the health score takes you directly to that tenant to allow you to investigate.
Moving to the right of the screen, you’ll see a couple of sections showing fault counts by domain and by type. You can clearly see from here how many faults of each category are present and once more, you are able to drill down further into the list of faults.
Finally, on the bottom right we have the APIC cluster health. In the example, I have only one APIC but you can see that it is in service and ‘fully fit’.
The ‘Tenants’ Tab
Moving along to the Tenants tab at the top of the page - after clicking here, you’ll see a screen similar to the following:
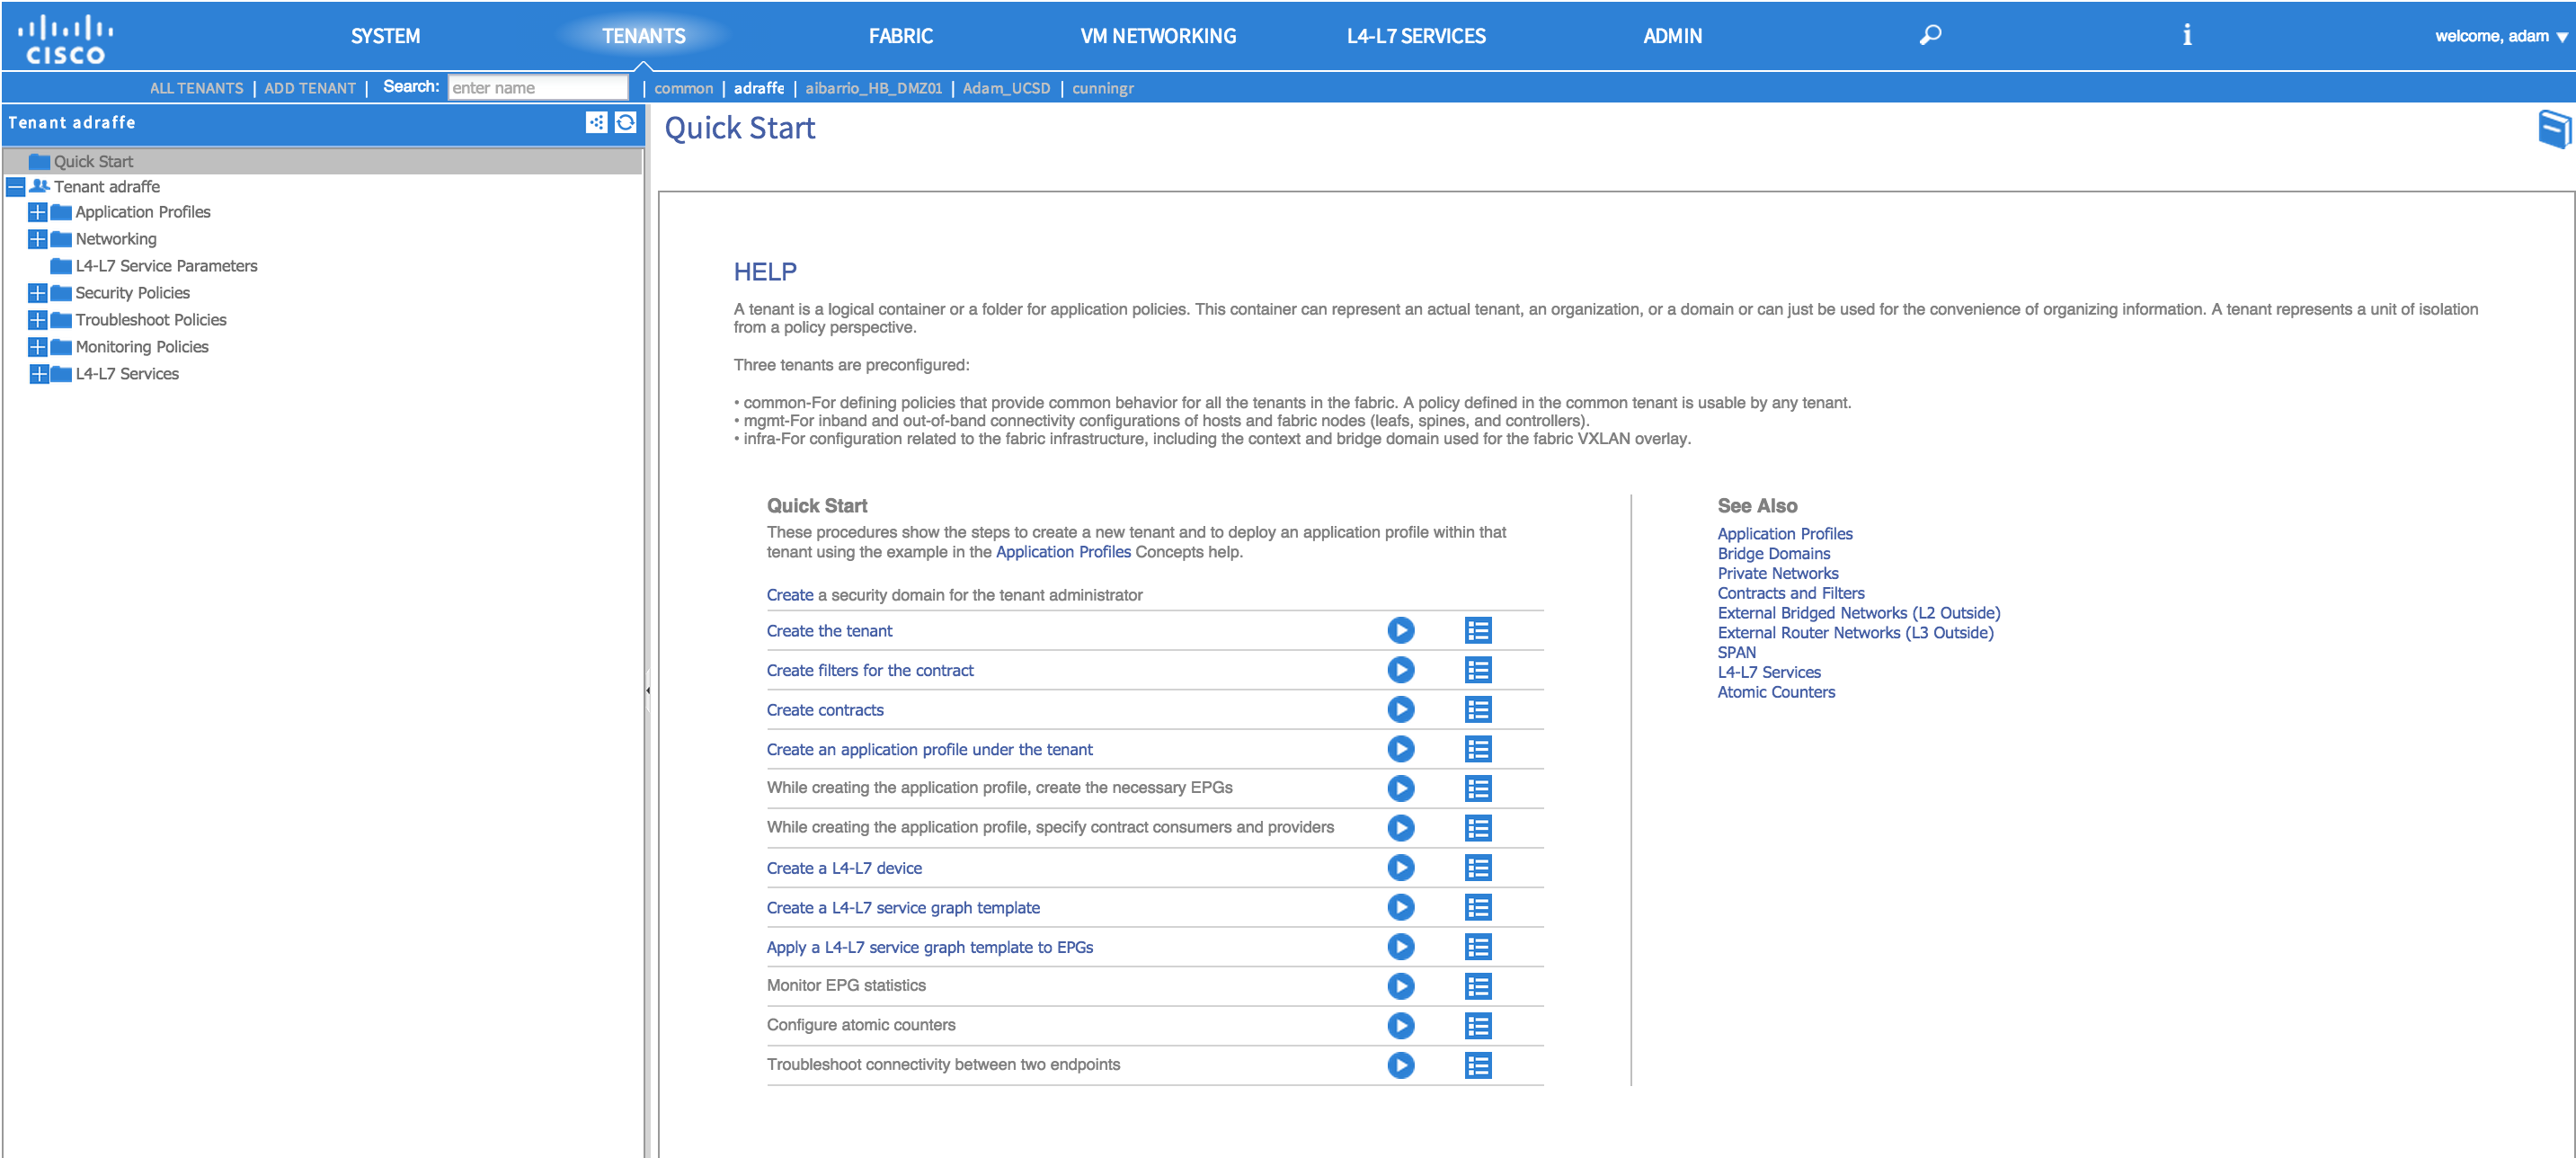
In the ‘sub-menu’ under the main Tenants tab, you’ll see a list of the most commonly used tenants. Under here, you will configure application profiles (EPGs, etc), networking (private networks, bridge domains, etc), security policies (contracts and filters) as well as a host of other items relating to troubleshooting and monitoring (SPAN and atomic counters for example). If you are using automated services insertion, that will also be configured under the tenant section.
The ‘Fabric’ Tab
The Fabric tab is used for a number of purposes: viewing fabric inventory information, fabric policy configuration (for example, altering the MTU used inside the fabric) and access policies (used to configure interfaces, VLAN pools, domains and so on - more of which in subsequent posts).
Clicking on the inventory sub-menu and then Topology, you’ll see a graphic representation of the entire fabric:
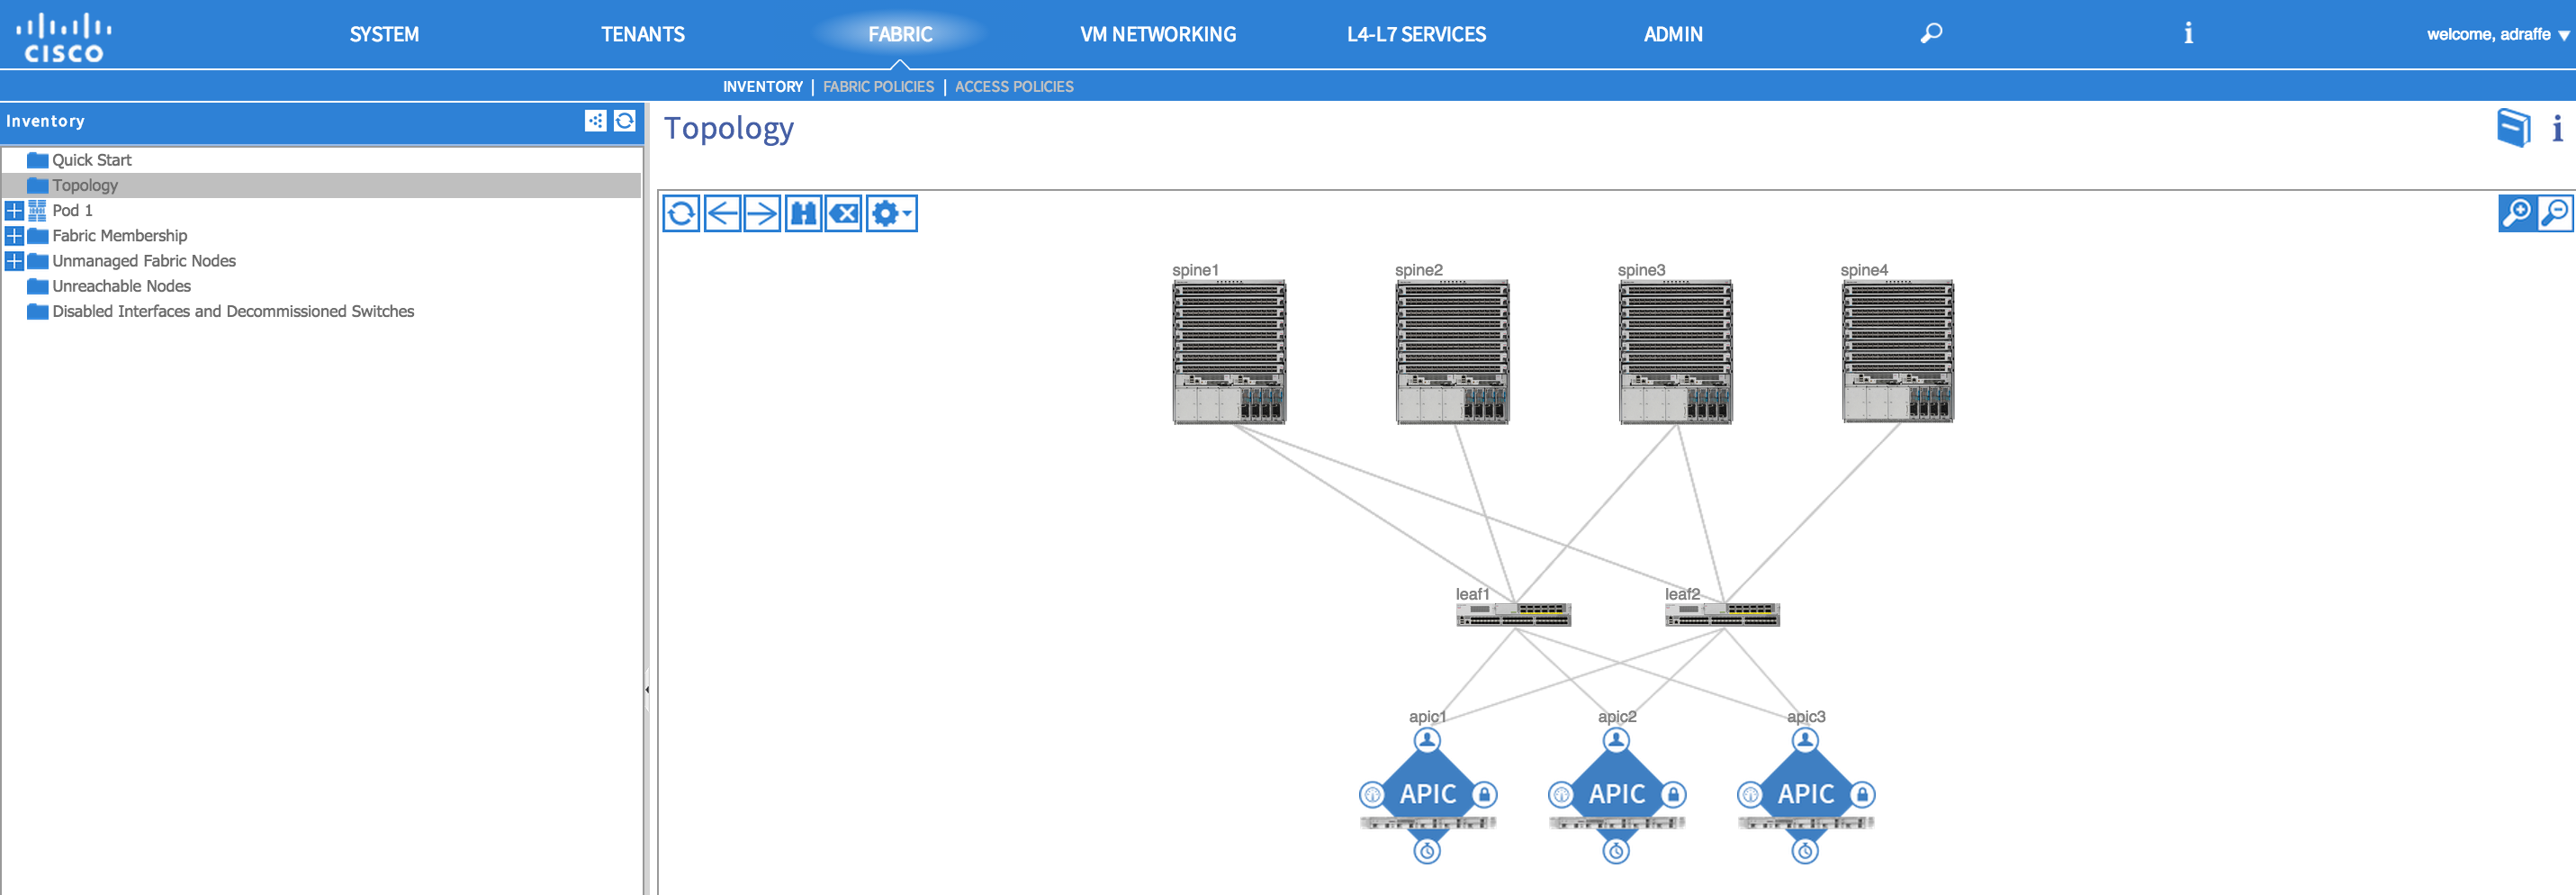
Right-clicking on any of the switches or APICs in the picture will allow you to perform some basic tasks such as decommissioning the node or configuring interfaces. Double clicking the node will take you to a more detailed view and allow you to perform further tasks.
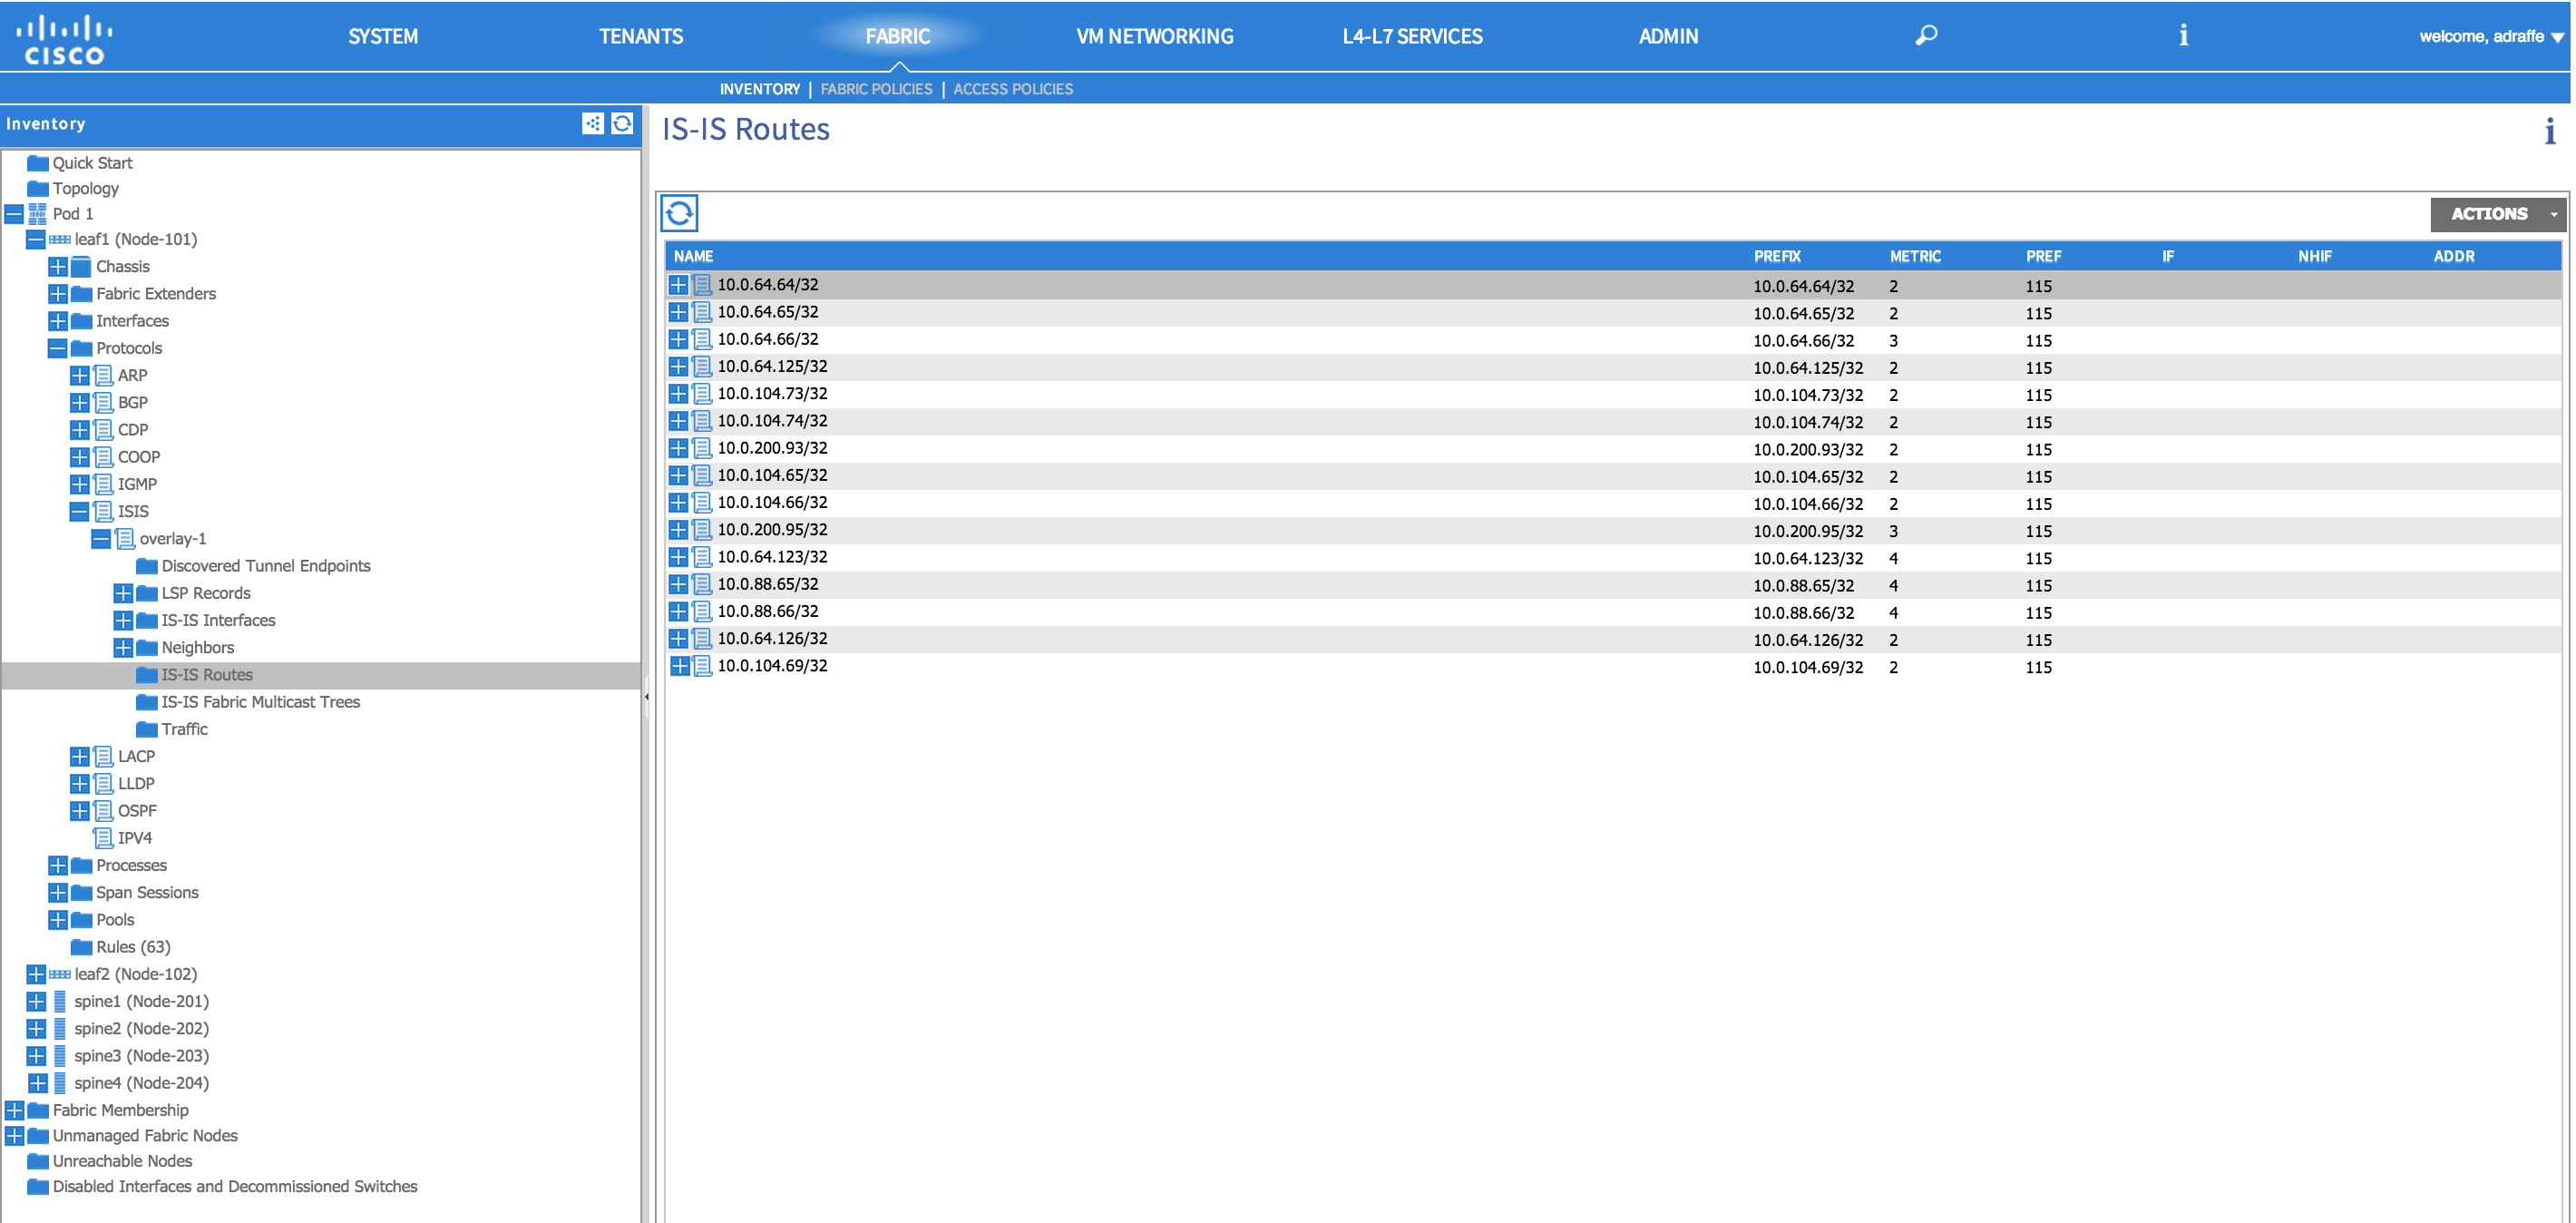
If we now expand the ‘Pod 1’ menu item on the left and then expand one of the nodes, we can see a whole host of information about the device in question. For example, we can see information about the chassis, Supervisor, linecards, power supplies for the device, interface information, protocol information (BGP, IS-IS, OSPF and more) and processes running. In the following example, I’m looking at the IS-IS routes present on the fabric:
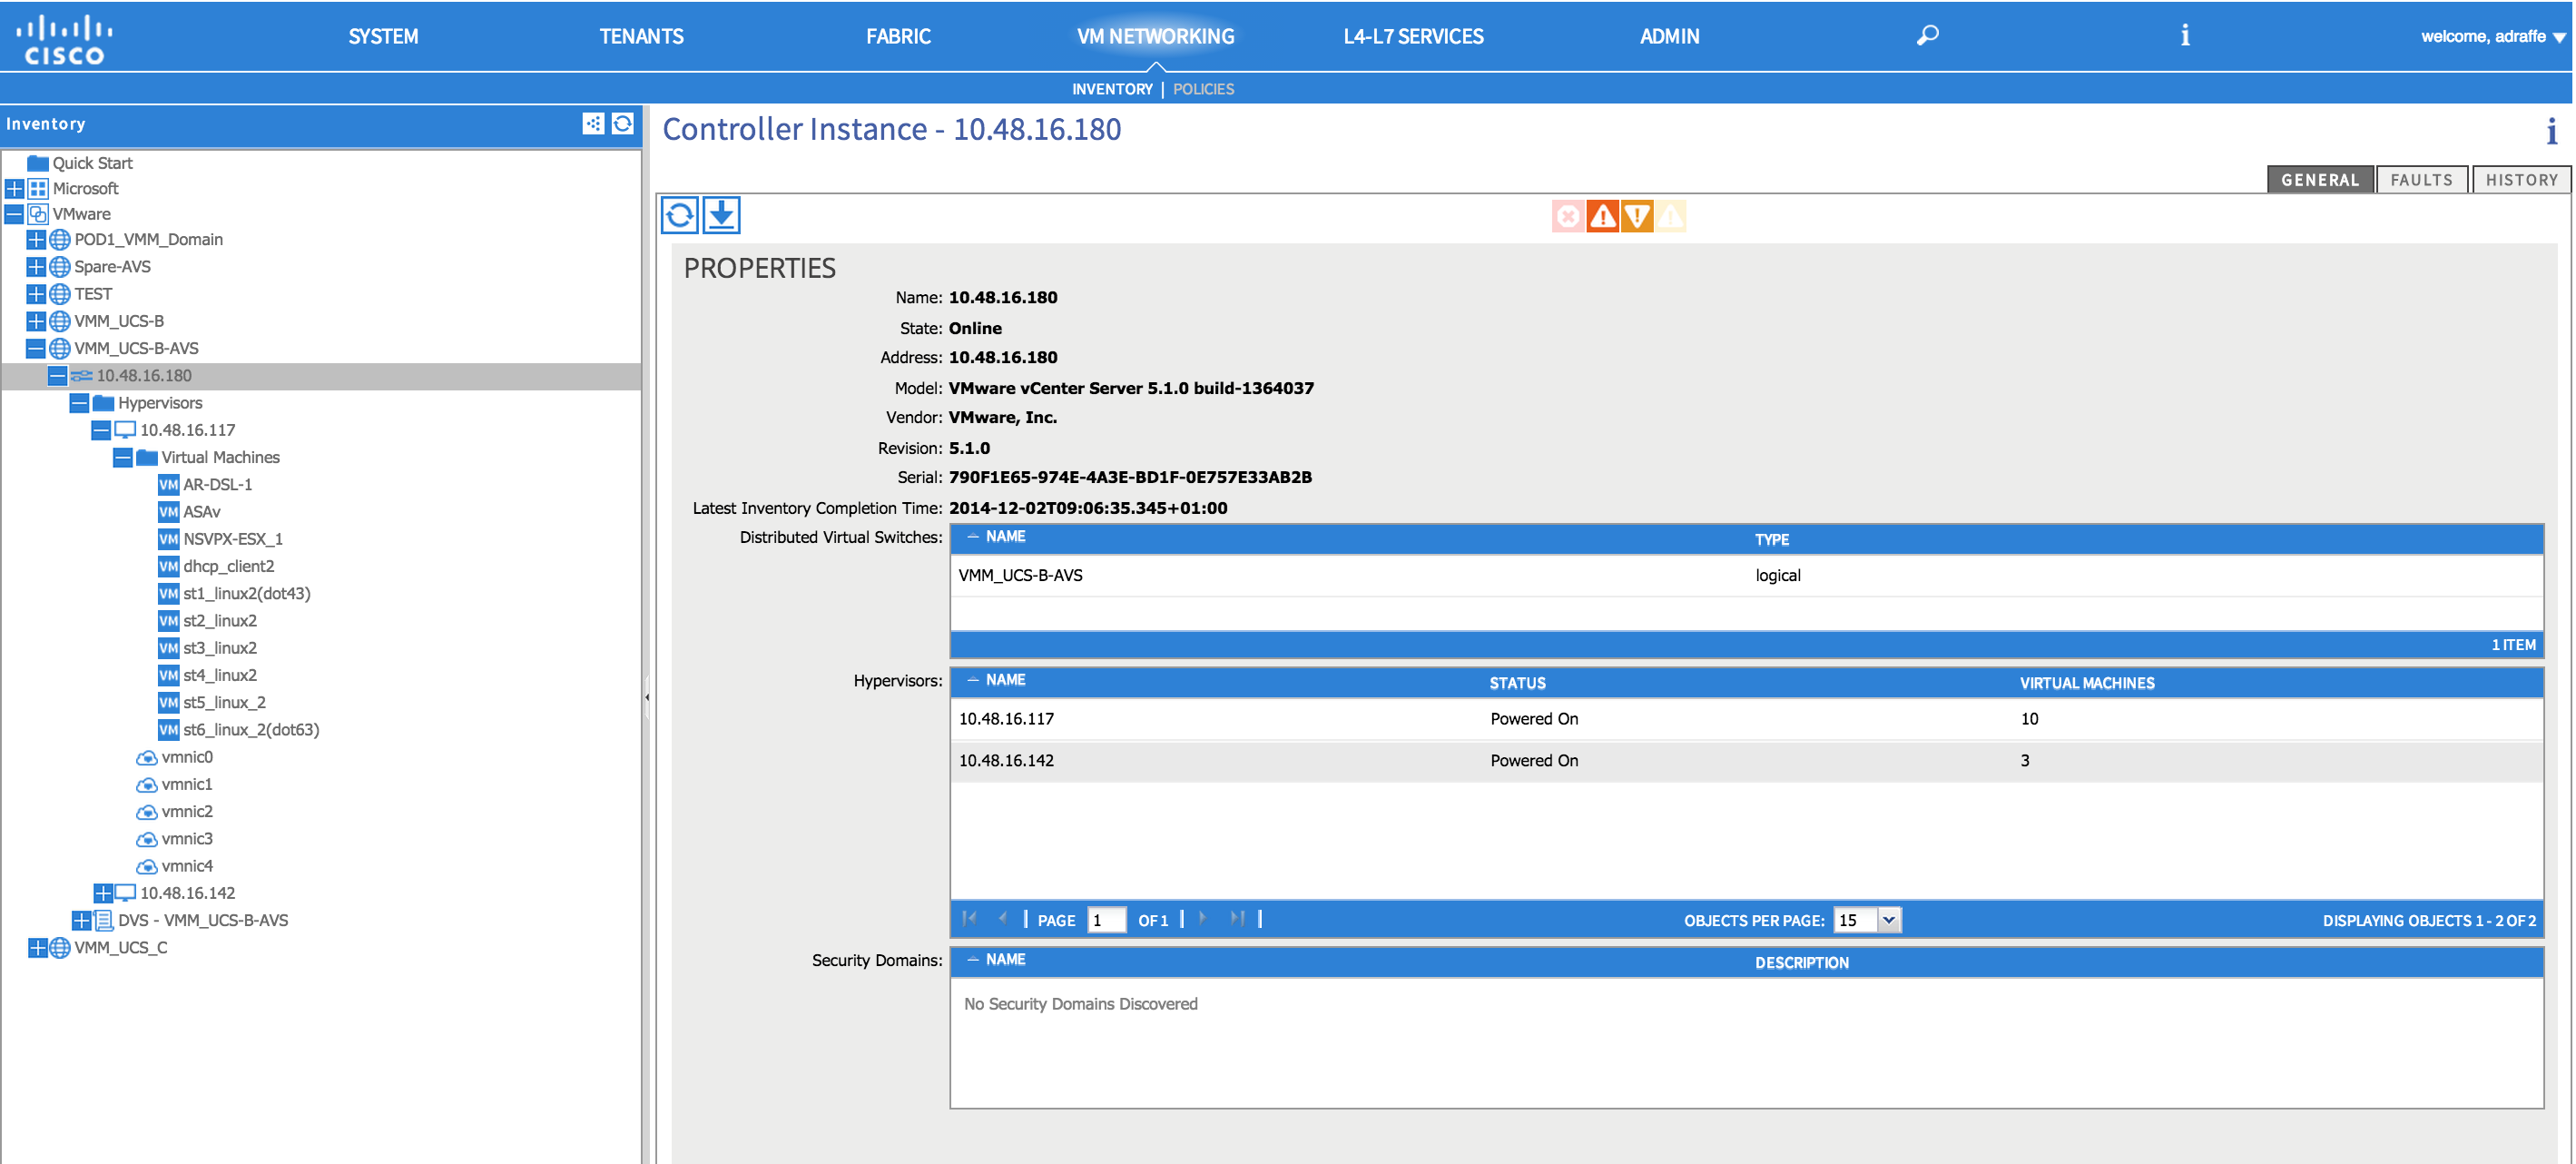
The ‘VM Networking’ Tab
VM Networking is where we configure ‘VMM domains’ - essentially, this is the integration with the virtualisation / hypervisor layer. I’ll be covering this in more detail in a later post, but assuming you have a VMM domain configured, from here you can view info such as ESXi hosts, virtual machines running on those hosts and the physical interfaces in use. You can also see info about the distributed virtual switch being used and any port groups that have been created.
The ‘L4-L7 Services’ Tab
This tab is mainly used to import device packages for a services device (such as a firewall or load balancer) into the APIC. Most of the actual L4-L7 services configuration (e.g. service graphs) are configured from the Tenants tab, so I won’t spend any time here.
The ‘Admin’ Tab
As you might guess, the Admin tab is the place where you will perform general administration tasks - for example, AAA config, firmware management and external monitoring destinations (Syslog, SNMP, etc) can all be managed from this tab.
What about the API?
So far we’ve only looked at the GUI, so those of you who are interested in using the APIC API might feel a bit left out. I’m hoping to cover some details about how to use the API in a later post, but for now there are a couple of handy tools that the APIC GUI contains to help you get familiar with how the API works.
The first of these tools is the API Inspector - you can get to this by clicking on the ‘Welcome’ button on the top right of the screen.
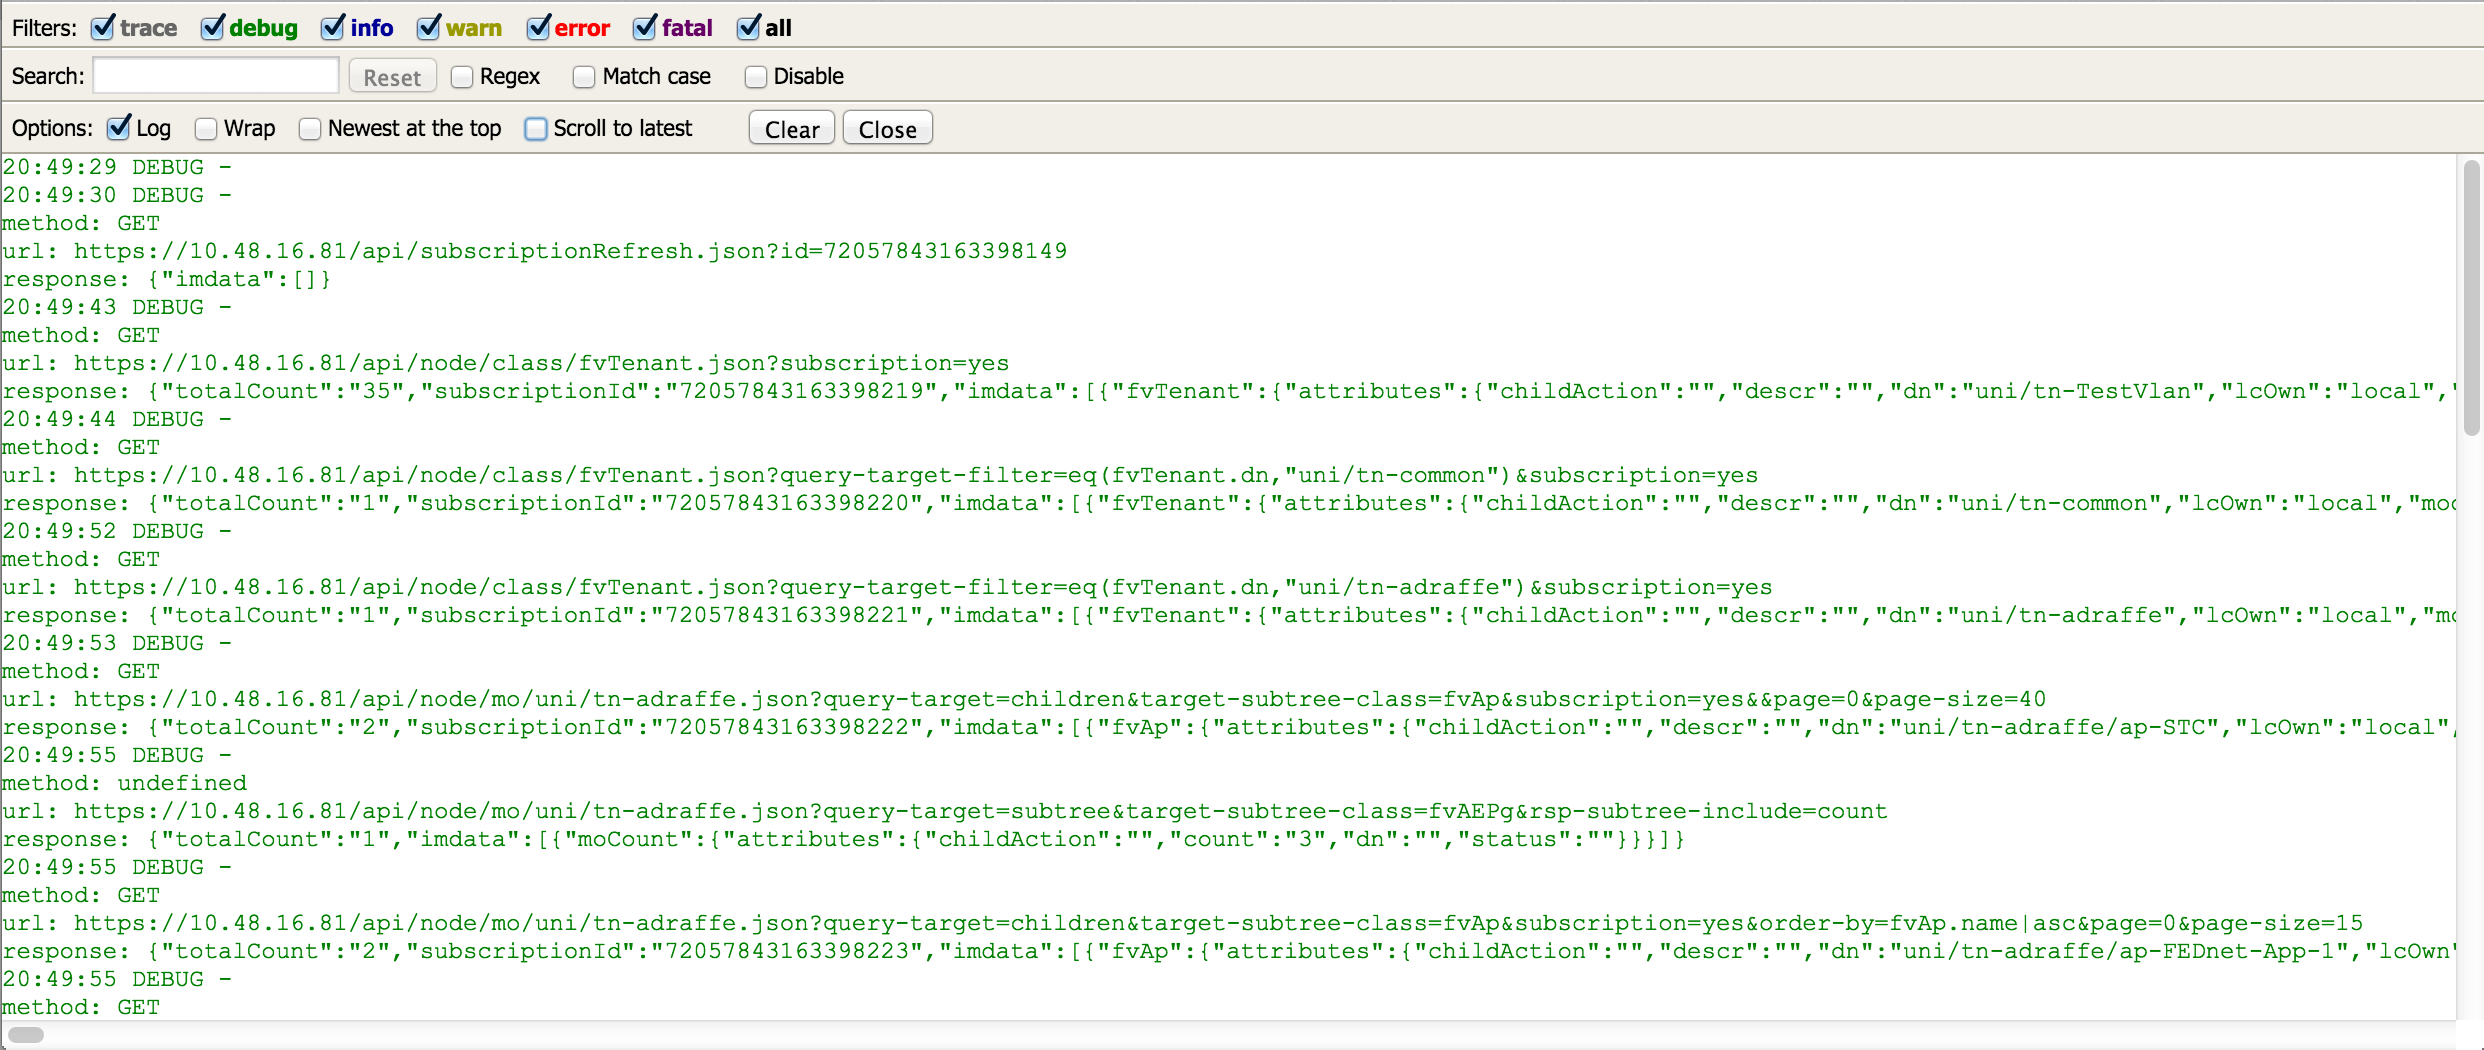
What this tool does is display the API calls made whenever you perform a task in the GUI. This is extremely useful because you can carry out a task in the GUI, capture it using the API Inspector and then use the JSON output to help you build your own scripts.
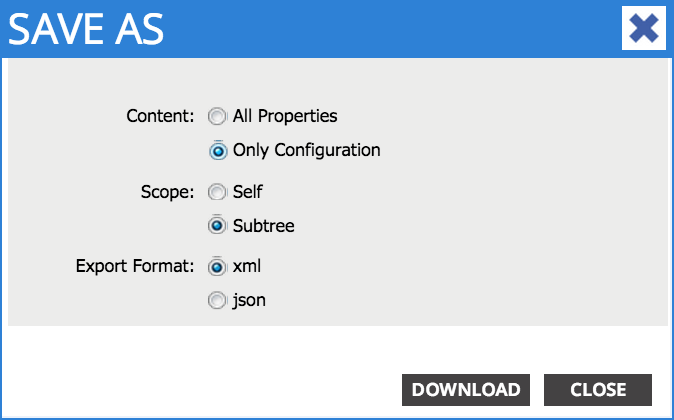
The second tool is the ability to ‘save’ the XML from almost any object in the GUI. Right clicking on an object (for example an application profile, EPG, Bridge Domain, etc) and selecting ‘Save As…’ will allow you to save the XML associated with that object to a local file. Again, you can use this XML to become familiar with the API, use in your own scripts, and so on.
That’s it for now - hopefully you’ve enjoyed this quick tour around the APIC. Now that you’re familiar with the basics, we can move on to the next steps - understanding application profiles, EPGs, contracts and filters. Check out part 4 for more on that.
Thanks for reading!